

IELTS Writing Task 1 Line Graph (Line Graph) là dạng bài khá phổ biến và thường xuyên xuất hiện. Dạng bài này yêu cầu thí sinh mô tả thông tin từ biểu đồ, thường thể hiện sự thay đổi của một hoặc nhiều biến số theo thời gian hoặc các yếu tố khác. Để làm tốt dạng bài này, bạn cần có vốn từ vựng IELTS Writing Task 1 Line Graph thực sự tốt.
Tổng hợp từ vựng IELTS Writing Task 1 dạng Line Graph
Dưới đây là tổng hợp từ vựng thường được sử dụng trong IELTS Writing Task 1 Line Graph:
Từ vựng Line Graph: Miêu tả sự tăng giảm
| Xu hướng | Danh từ | Động từ |
| Xu hướng tăng | An increase of | increase |
| A climb of | climb, go up | |
| A growth of | grow | |
| A rise of | rise | |
| An upward trend | trend upward | |
| A doubling in +N | double | |
| A trebling in + N | treble | |
| A boom | boom | |
| A surge | surge | |
| Xu hướng giảm | a decrease of | decrease |
| a fall of | fall | |
| a decline of | decline | |
| a drop of | drop | |
| a reduction | go down | |
| a slump | slump | |
| a plunge | plunge | |
| a plummet | plummet | |
| dive | ||
| dip |
Ví dụ:
- There was an increase of 20% in sales from 2020 to 2021.
- The graph depicts a fall of 5% in consumer confidence.
Từ vựng IELTS Writing Task 1 Line Graph: Tốc độ tăng giảm
- Slowly /ˈsloʊli/: Một cách chậm rãi.
- Rapidly /ˈræpɪdli/: Một cách nhanh chóng.
- Steadily /ˈstɛdɪli/: Một cách ổn định.
- Sharply /ˈʃɑrpli/: Một cách đột ngột, mạnh.
- Gradually /ˈɡrædʒuəli/: Một cách từ từ, dần dần.
Ví dụ:
- The number of visitors to the museum increased slowly over the five-year period.
- The production levels gradually increased over the course of the year.
Xem thêm: Trọn bộ từ vựng IELTS Writing task 1 Bar Chart ăn điểm
Từ vựng Writing Task 1 Line Graph miêu tả mức độ thay đổi
| Mức độ | Tính từ | Trạng Từ |
| Thay đổi nhanh | Dramatic | Dramatically |
| Significant | Significantly | |
| Remarkable | Remarkably | |
| Considerable | Considerably | |
| Rapid | Rapidly | |
| Sharp | Sharply | |
| Steep | Steeply | |
| Thay đổi vừa phải | Noticeable | Noticeably |
| Moderate | Moderately | |
| Marked | Markedly | |
| Thay đổi chậm | Steady | Steadily |
| Gradual | Gradually | |
| Slight | Slightly | |
| Small | smallly | |
| Minimal | Minimally |
Ví dụ:
- There was a significant rise in sales during the holiday season.
- The number of tourists grew remarkably during the summer months.
- The company has moderately expanded its market share over the last year.
- There was a gradual decline in the number of coal-fired power plants.
Từ vựng Line Graph biểu thị mức độ
- High /haɪ/: Cao.
- Low /loʊ/: Thấp.
- Peak /piːk/: Đỉnh điểm, điểm cao nhất.
- Bottom /ˈbɒt.əm/: Đáy, điểm thấp nhất.
- Plateau /plæˈtoʊ/: Sự ổn định, không tăng giảm đột ngột.
Ví dụ:
- Sales reached a low point in January, indicating a seasonal trend.
- The number of tourists visiting the city reached its peak in July.
- The graph illustrates that the unemployment rate hit its bottom in 2015.
Từ vựng Task 1 Line Graph biểu thị số liệu
- Percentage /pərˈsɛn.tɪdʒ/: Tỷ lệ phần trăm.
- Number /ˈnʌm.bər/: Số lượng.
- Amount /əˈmaʊnt/: Số tiền, số lượng.
- Figure /ˈfɪɡ.ər/: Con số.
Ví dụ: The percentage of students passing the exam increased from 60% to 80% over three years.
Từ vựng IELTS Writing Task 1 Line Graph miêu tả xu hướng
- Trend /trɛnd/: Xu hướng.
- Pattern /ˈpæt.ərn/: Mô hình.
- Fluctuation /ˌflʌk.tʃuˈeɪ.ʃən/: Sự biến đổi.
- Growth rate /ɡroʊθ reɪt/: Tốc độ tăng.
- Peak season /piːk ˈsiː.zən/: Mùa cao điểm.
Ví dụ: The data shows significant fluctuation in the stock market prices throughout the year.
Từ vựng Line Graph biểu thị sự biến thiên
- Seasonal /ˈsiː.zən.əl/: Theo mùa.
- Spring /sprɪŋ/: Mùa xuân.
- Summer /ˈsʌm.ər/: Mùa hè.
- Autumn /ˈɔː.təm/: Mùa thu.
- Winter /ˈwɪn.tər/: Mùa đông.
Ví dụ: The graph illustrates seasonal variations in sales, with peaks during the holiday months.
Cấu trúc câu ăn điểm cho Line Graph
Dưới đây là các loại cấu trúc thông dụng thường dùng trong dạng bài Line Graph:
Cấu trúc mô tả số lượng với trạng từ
(Số lượng, phần trăm cái gì) + V (tăng, giảm, giữ nguyên không đổi) + adv (một cách nhanh chóng, một cách đều đặn, một cách chậm chạp).
Ví dụ: The number of visitors to the museum rose steadily from 5,000 to 10,000 between 2015 and 2018.
Cấu trúc “There”
There + to be + a/an + adj + N + in + (số lượng, phần trăm của cái gì).
Ví dụ: There was a noticeable decline in the percentage of smokers in the city, dropping from 25% to 15% over the last decade.
Cấu trúc với động từ witness/see/experience
S + witness/see/experience + adj (nhanh, chậm) + sự tăng/giảm + in + (số lượng, phần trăm của cái gì).
Ví dụ: The company experienced a rapid increase in sales, with figures rising from 1 million to 2.5 million units sold from 2020 to 2023.
Cấu trúc mô tả xu hướng
(Số lượng, phần trăm) + V + over + (thời gian).
Ví dụ: The population of the city expanded dramatically over the last five years, growing from 300,000 to 450,000 residents.
Cấu trúc so sánh
(Số lượng, phần trăm) + V (tăng, giảm) + in comparison with + (số lượng, phần trăm khác).
Ví dụ: The number of online shoppers increased by 40% in comparison with traditional retail sales, which saw only a 10% rise.
Ứng dụng vào bài mẫu IELTS Writing Task 1 Line Graph
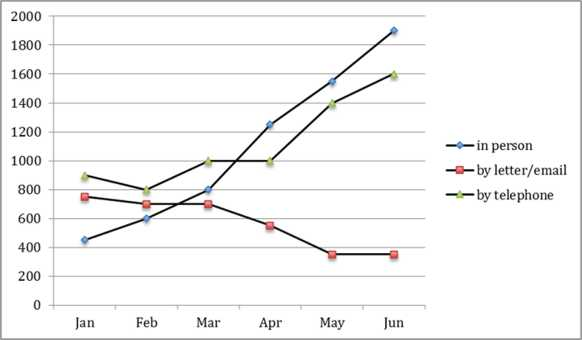
The graph below shows the number of enquiries received by the Tourist Information Office in one city over a six-month period in 2011. Summarize the information by selecting and reporting the main features and make comparisons where relevant.
Sample:
The line graph illustrates the number of enquiries received by the Tourist Information Office in one city from January to June 2011 through three methods: in person, by letter/email, and by telephone.
Overall, the number of in-person and telephone enquiries witnessed a significant increase over the six-month period, while enquiries made by letter or email experienced a steady decline.
In January, telephone enquiries were the most common, at 900, followed by those made by letter/email at 750, while only 450 people made enquiries in person. However, from March onwards, the number of in-person enquiries surged dramatically, surpassing telephone enquiries in April and reaching a peak of around 1,900 in June. This represents a remarkable growth during the period.
Similarly, telephone enquiries exhibited a moderate upward trend. After fluctuating slightly between 800 and 1,000 from January to March, they rose steadily, reaching 1,600 by June. In contrast, the number of enquiries made via letter/email dropped gradually, falling from 750 in January to below 400 by June.
To summarize, while in-person and telephone enquiries grew sharply over the period, letter or email enquiries showed a noticeable decline.
Trên đây là danh sách từ vựng IELTS Writing Task 1 Line Graph cùng với cấu trúc và ví dụ cụ thể. Hy vọng rằng những kiến thức trên có thể giúp bạn tham khảo, học tập và thực hành tốt để tối ưu điểm số trong bài thi của mình. Bạn cũng có thể tham khảo các khóa học IELTS tại IELTS The Tutors để cải thiện và nâng cao kỹ năng, giúp tối ưu thời gian trong quá trình chinh phục chứng chỉ danh giá này.